Visualizing the Homeownership Journey
Visualizing the Homeownership Journey
Client: American Family Insurance
Role: Designer, Concept Development
Year: 2018
Client: American Family Insurance
Role: Designer, Concept Development
Year: 2018
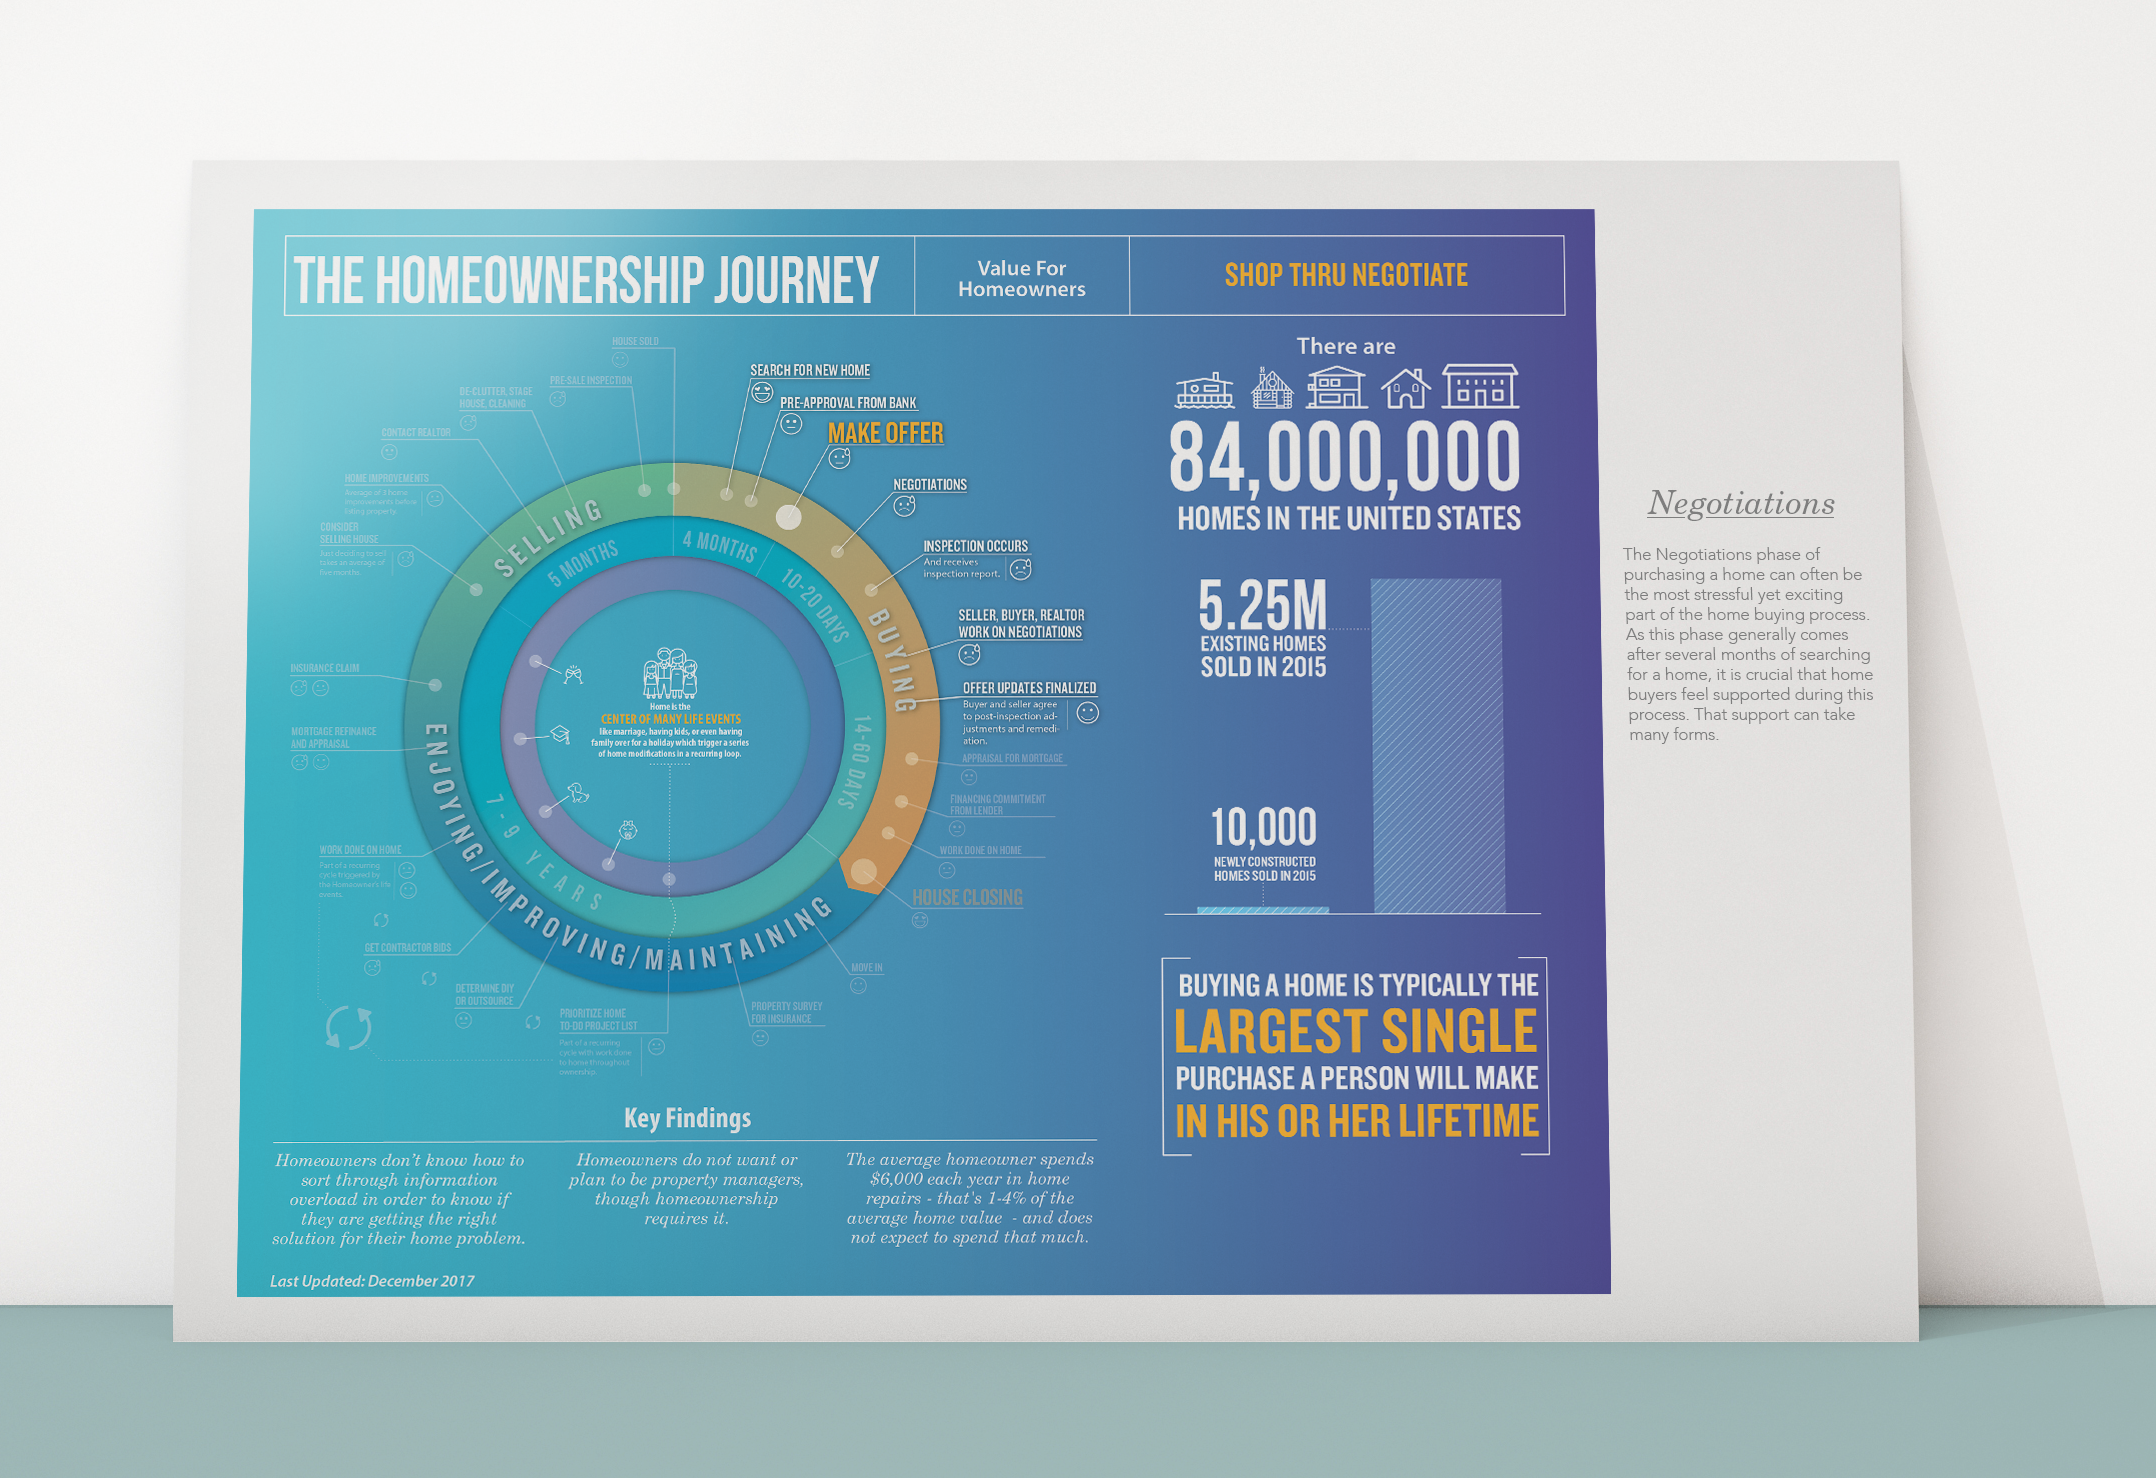
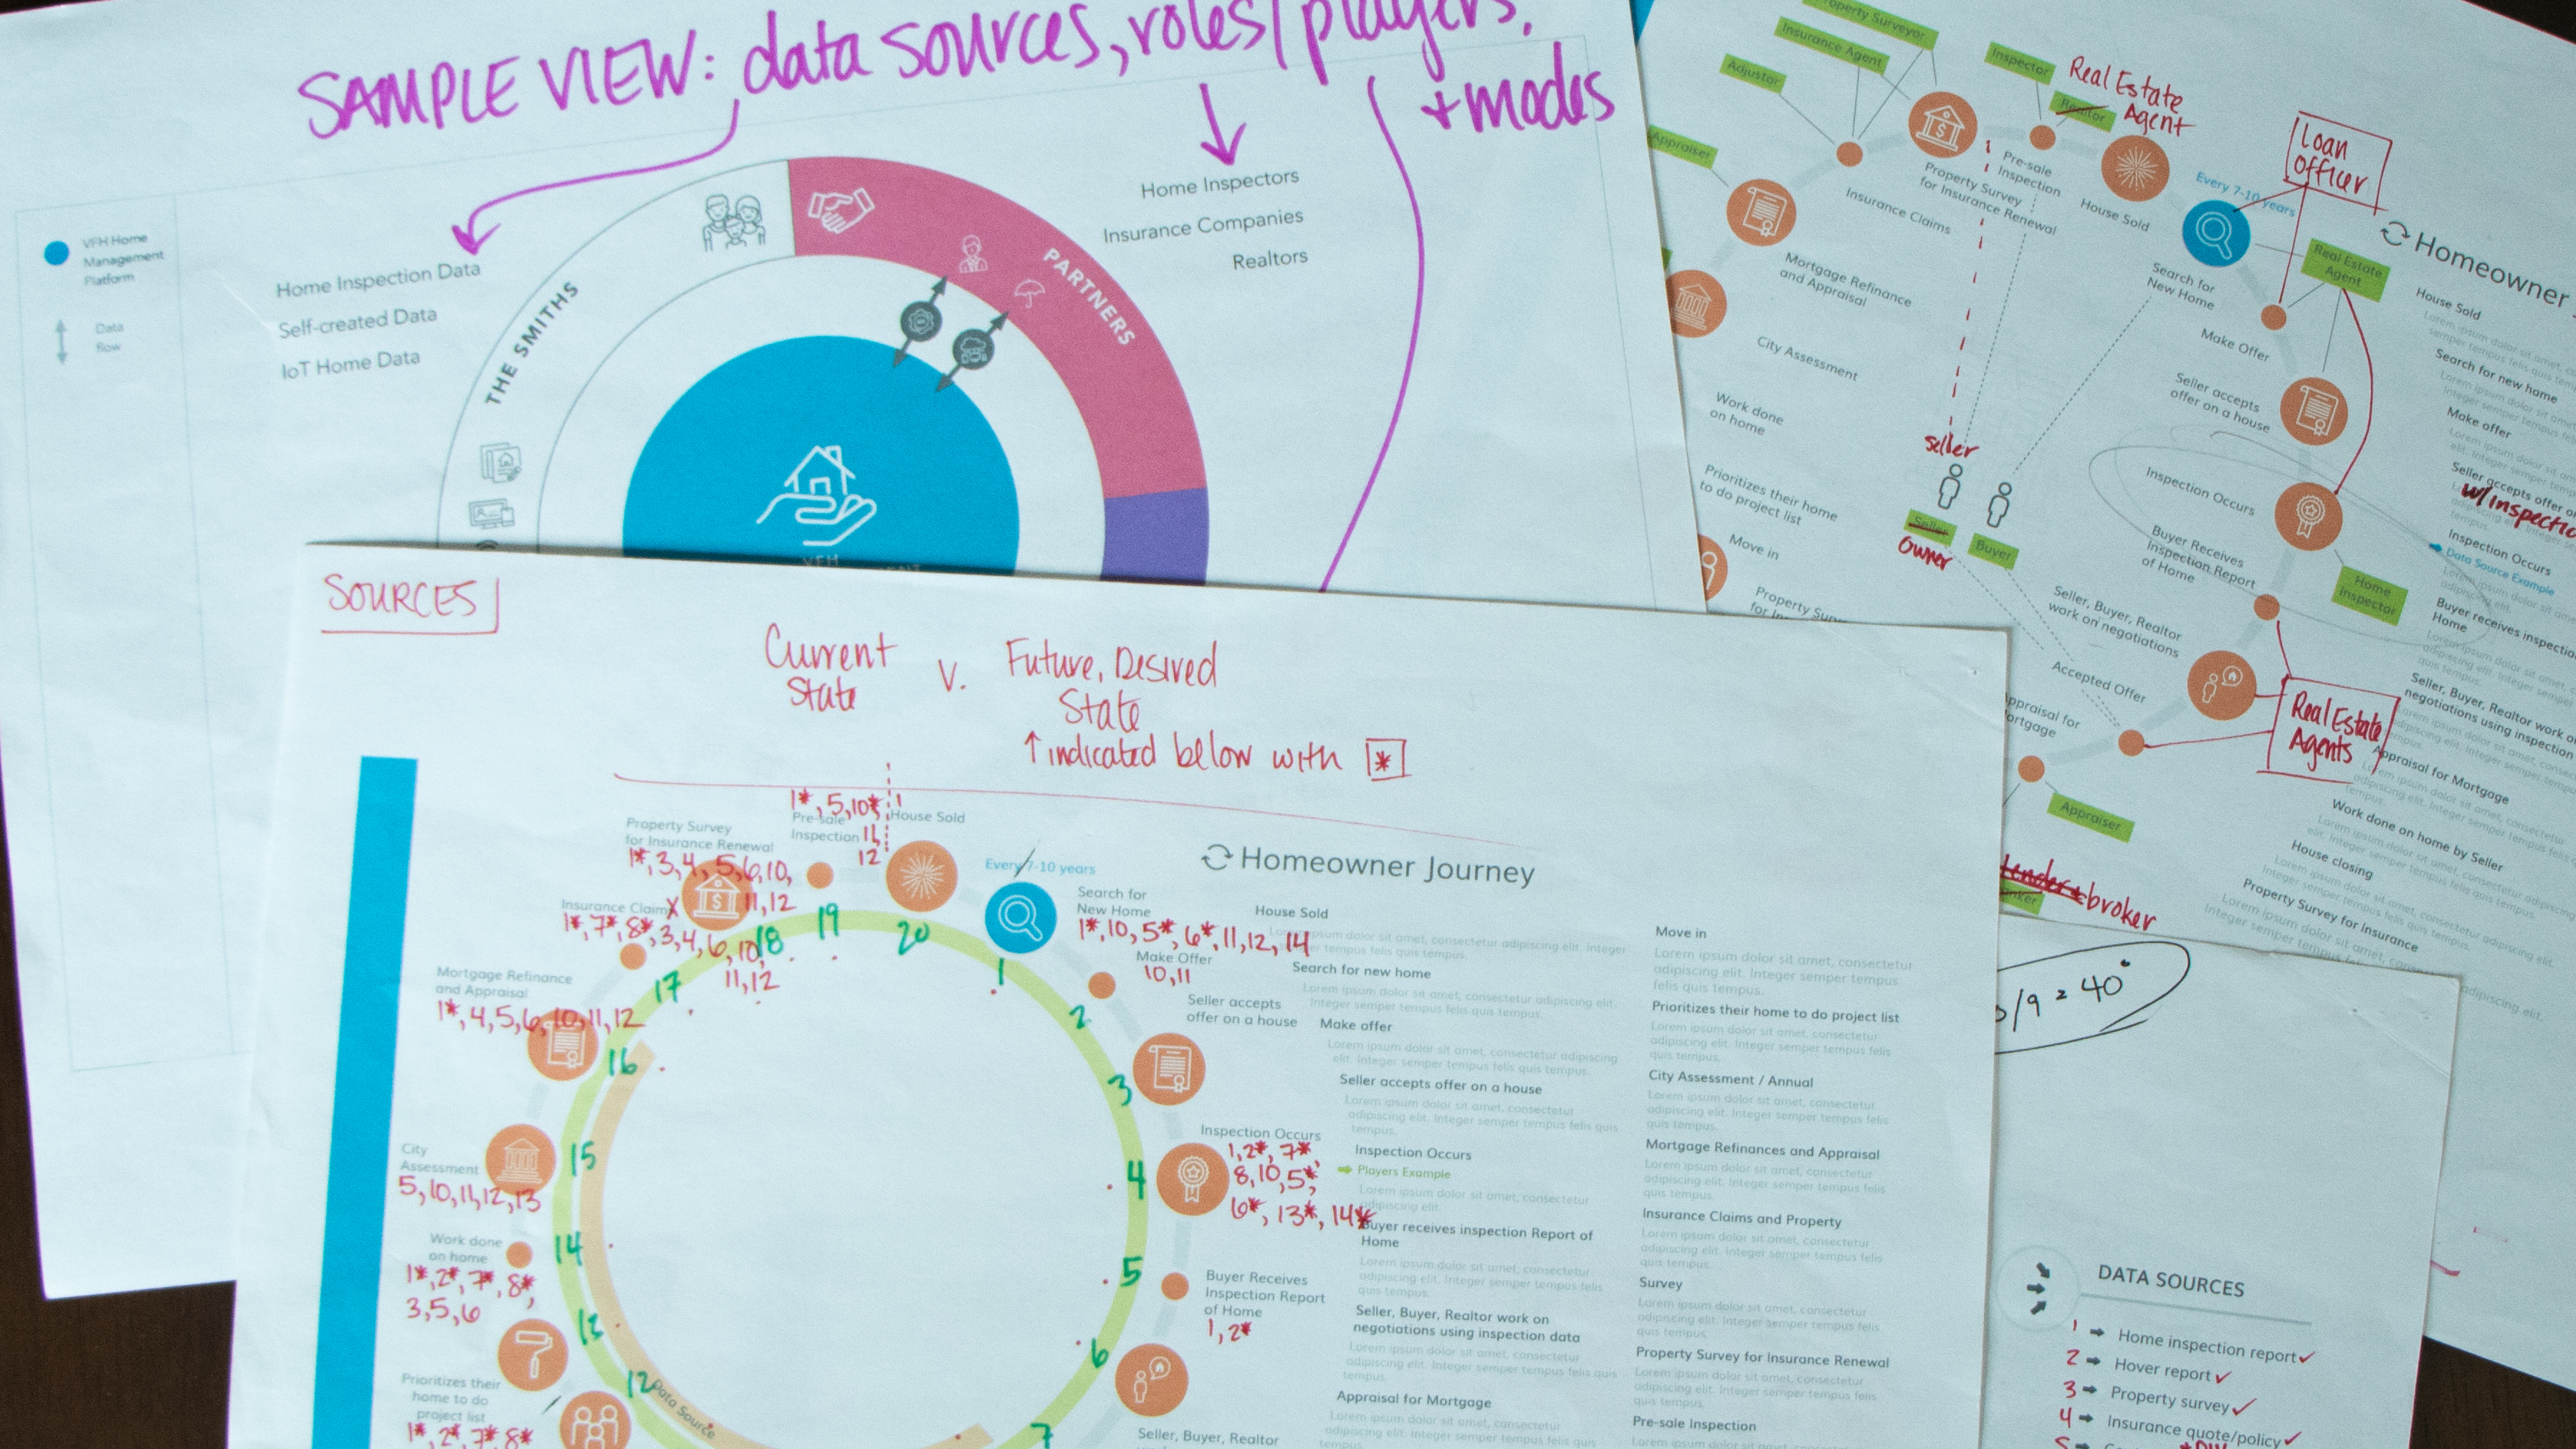
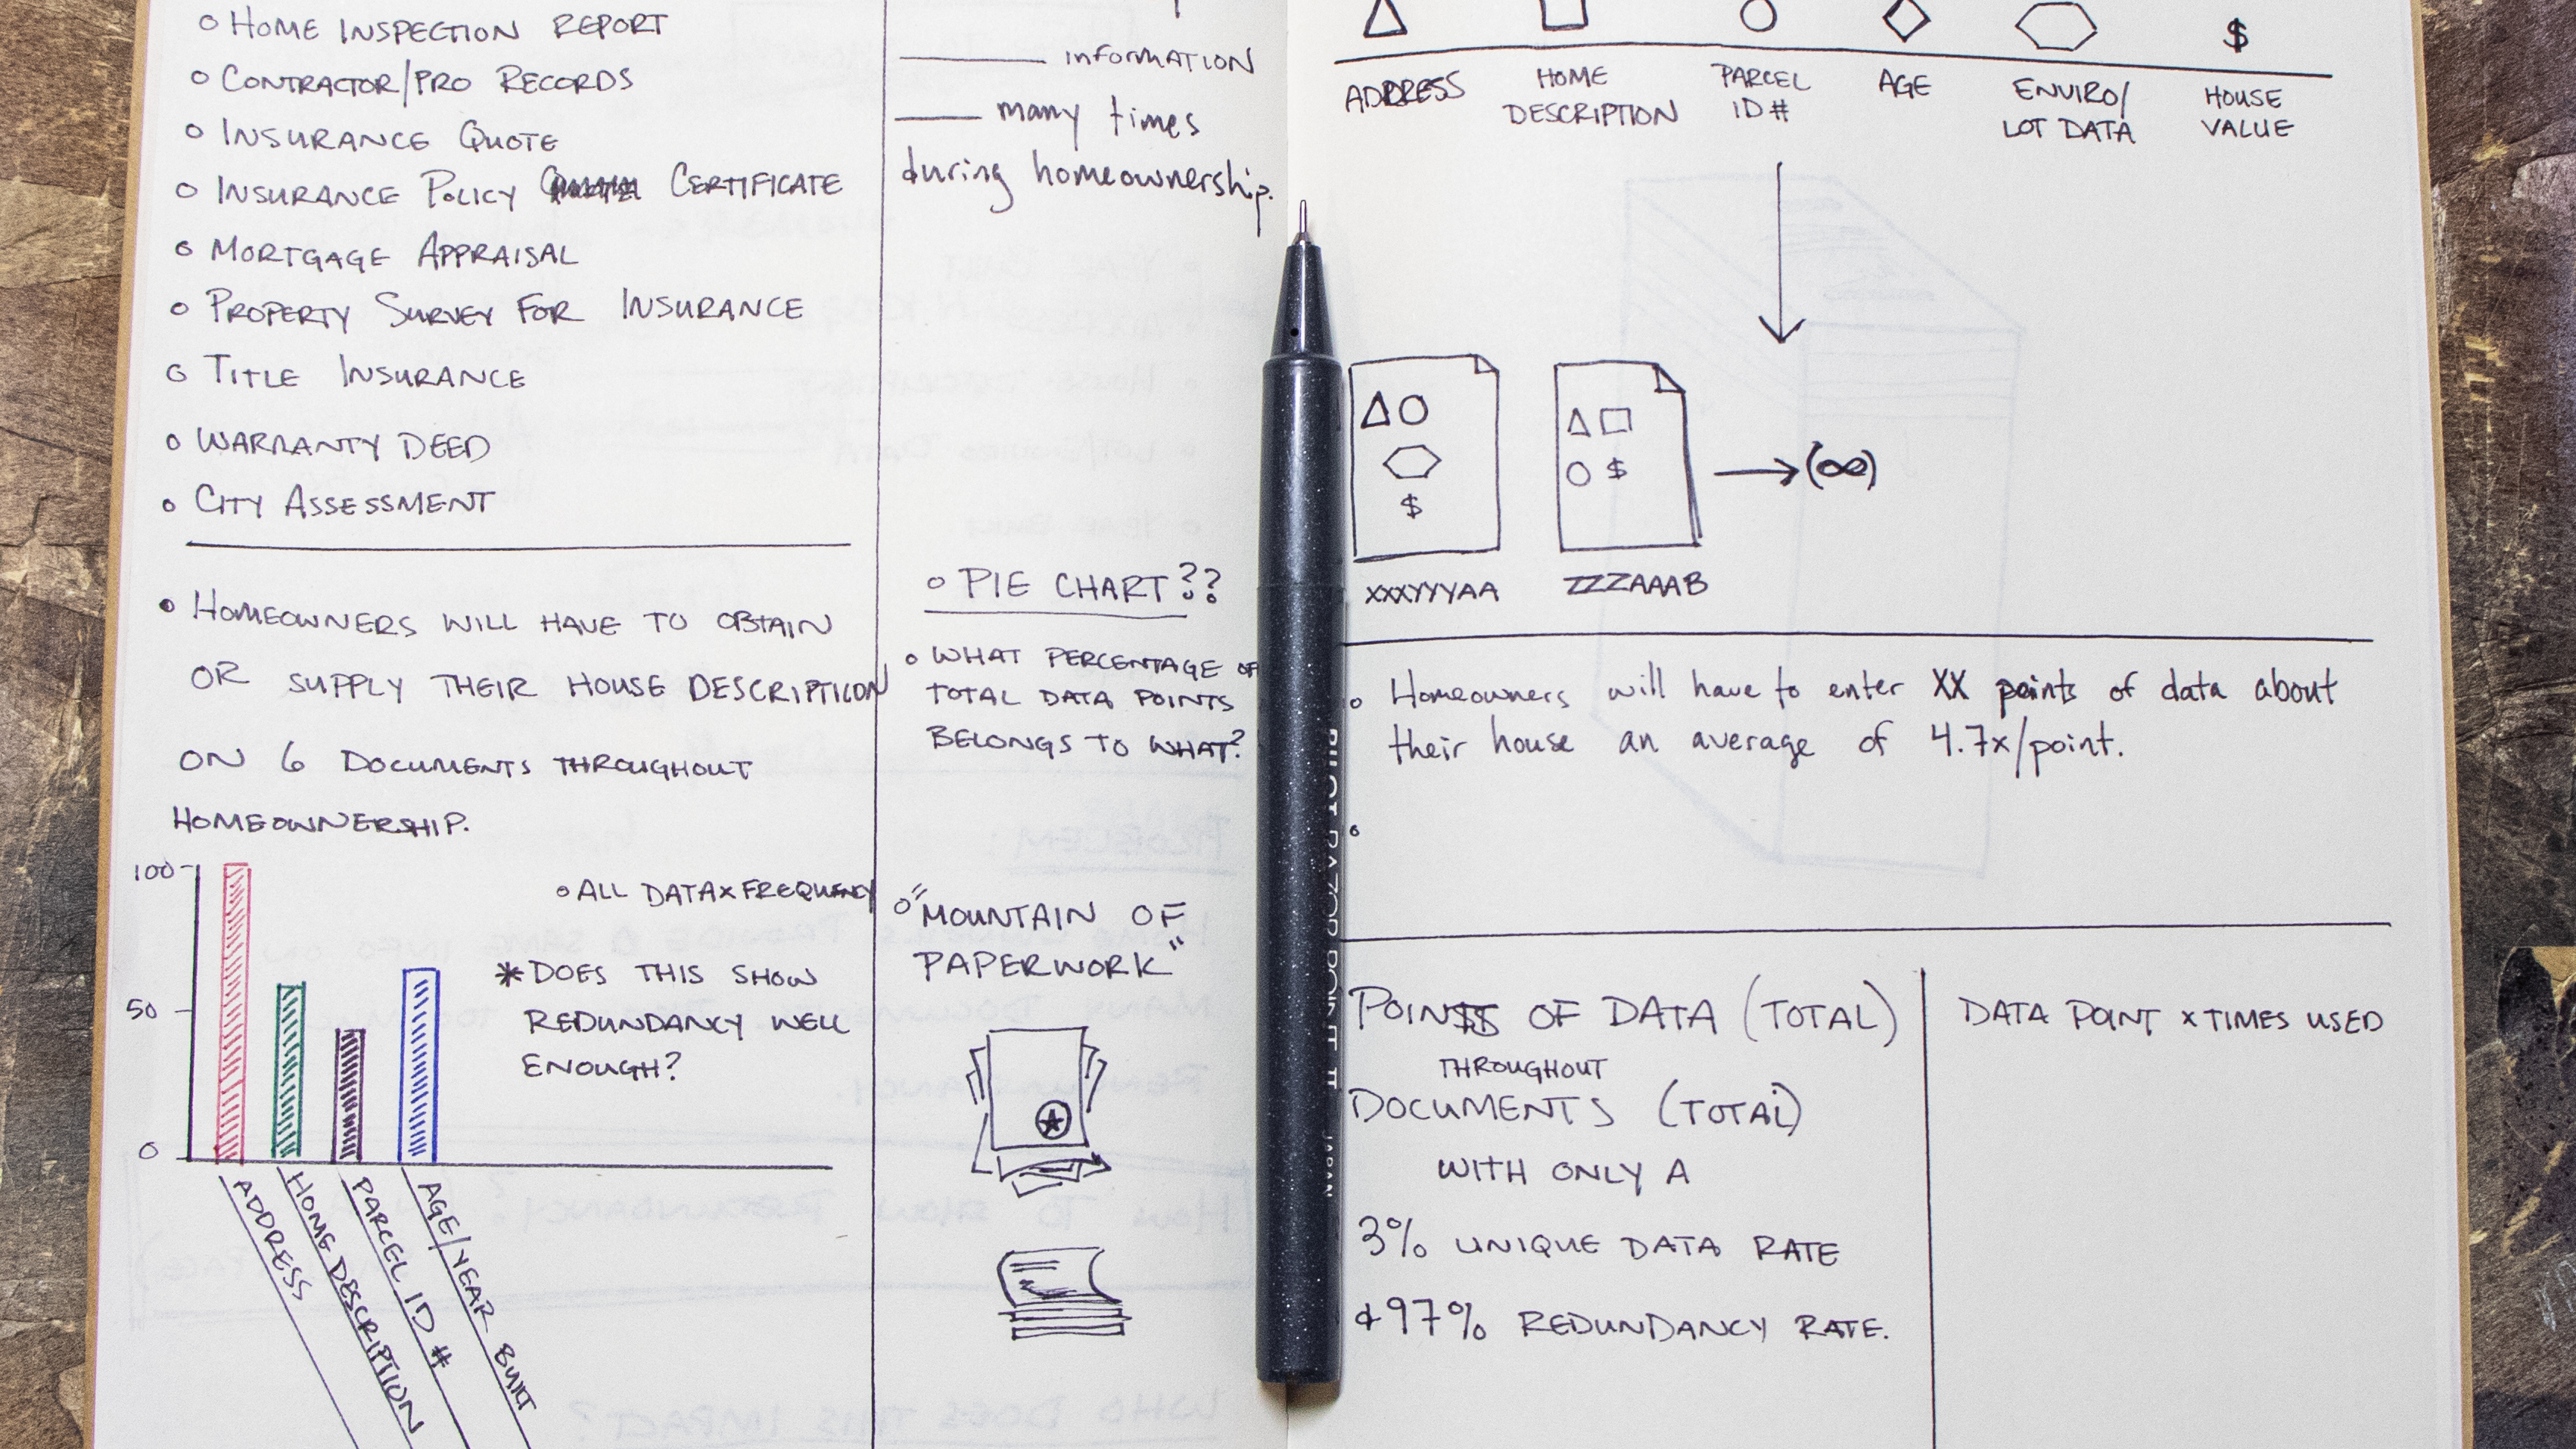
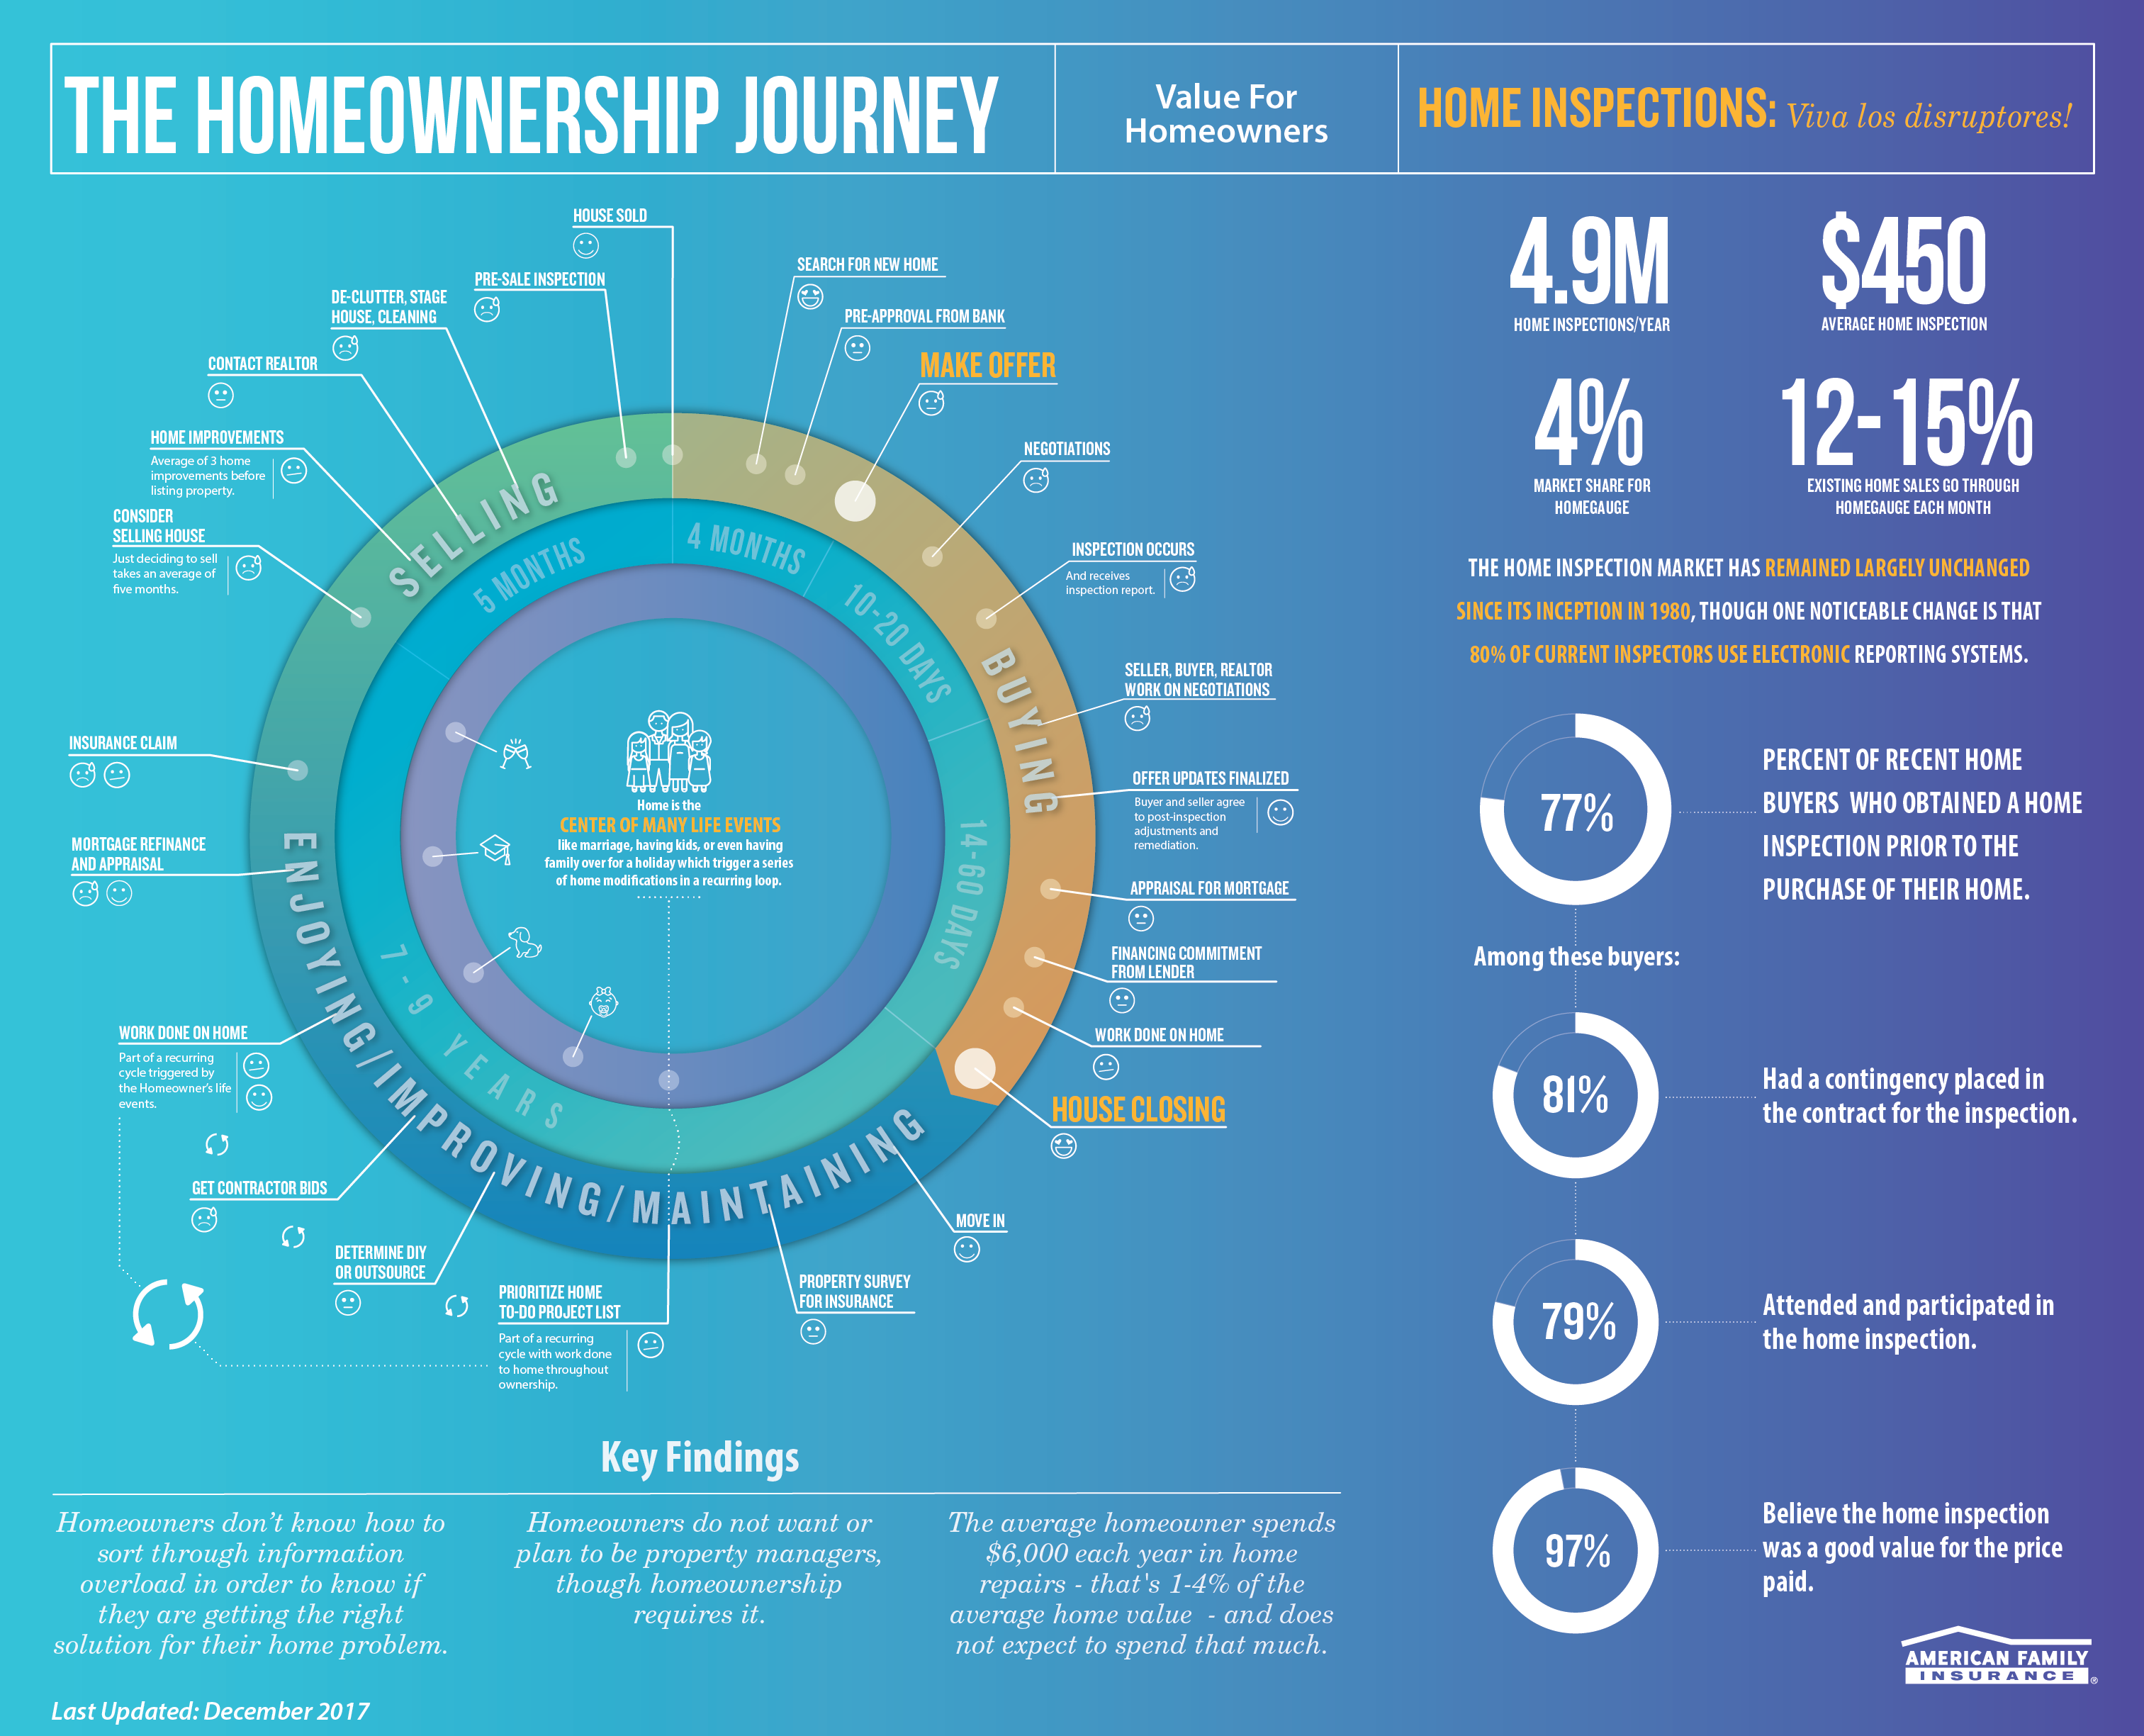
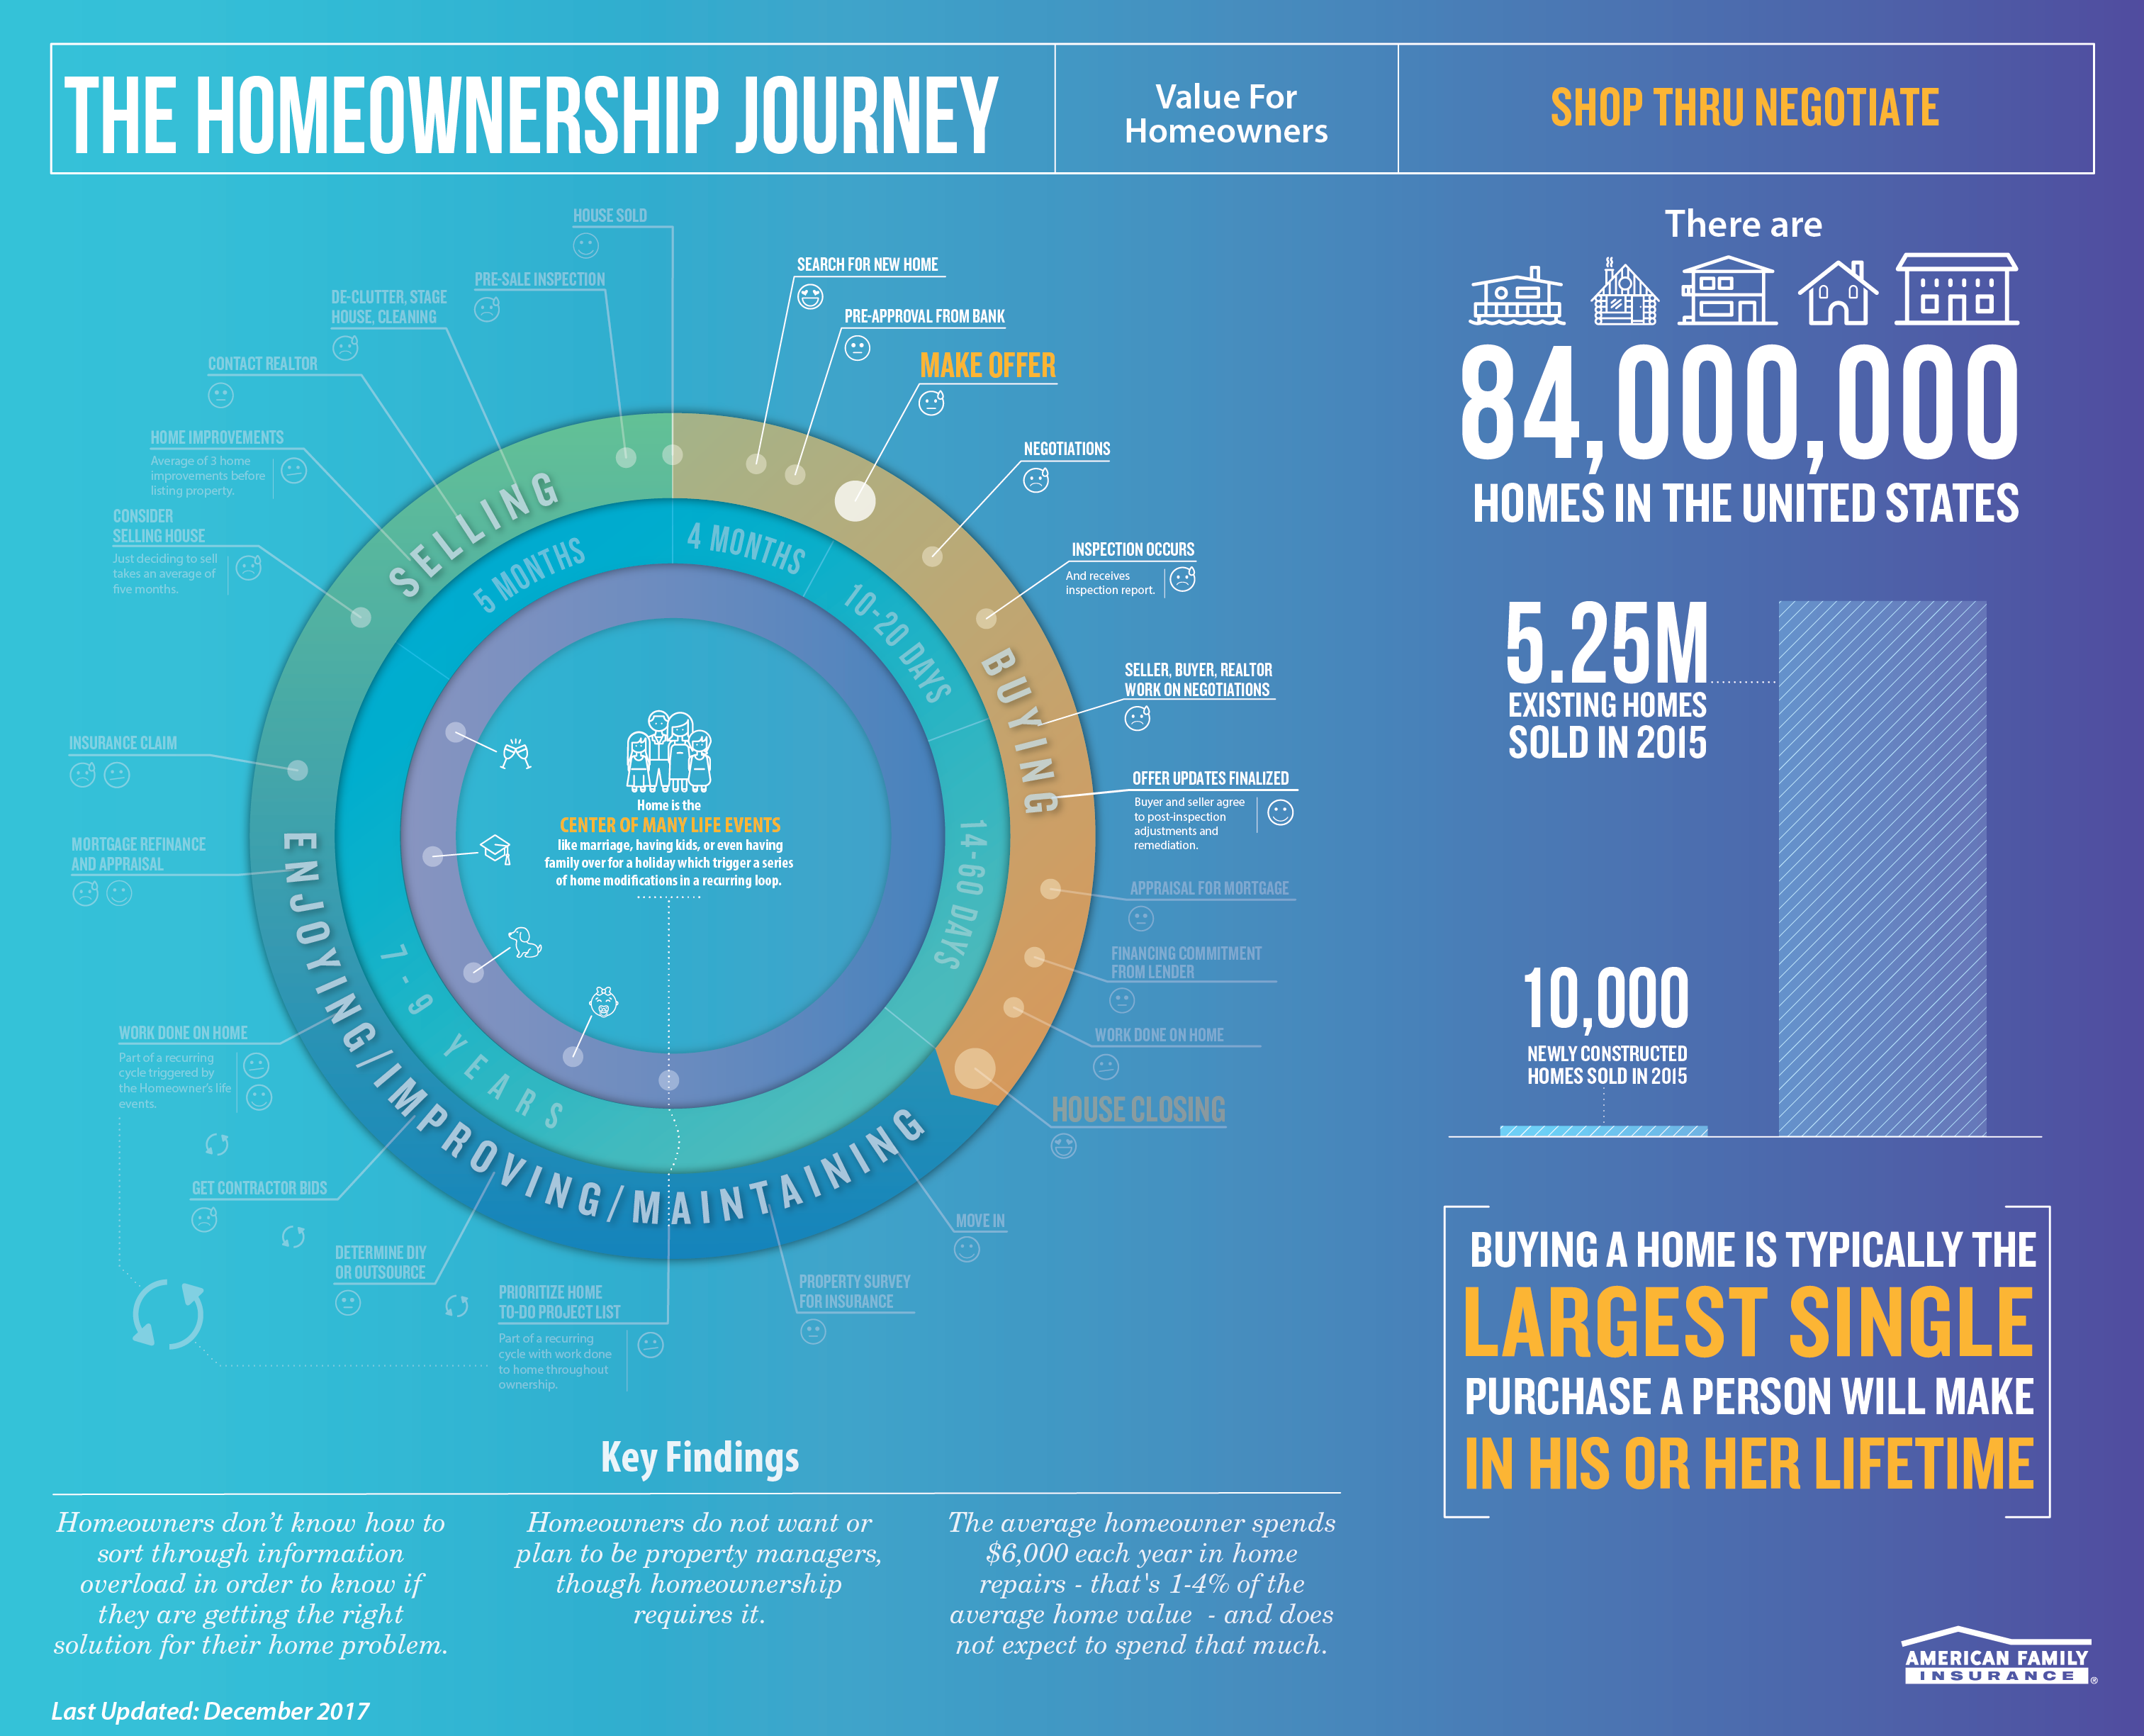
After a year of research and exploration, an internal innovation team needed infographics to help them visualize both the journey of homeownership, as well as new inflection points for insurance providers in the home services space. In order to meet these needs, I created a series of five infographics that connected hard data to human experience, demonstrated the case for further investment, acquisitions, and exploration, and specific opportunity areas within the $400-800B Home Services space.
After a year of research and exploration an internal innovation team needed infographics to help them visualize both the journey of homeownership, as well as new inflection points for insurance providers in the home services space. In order to meet these needs I created a series of five infographics that connected hard data to human experience, demonstrated the case for further investment, acquisitions, and exploration and specific opportunity areas within the $400-800B Home Services space.
A Static Journey with Dynamic Data & Storytelling
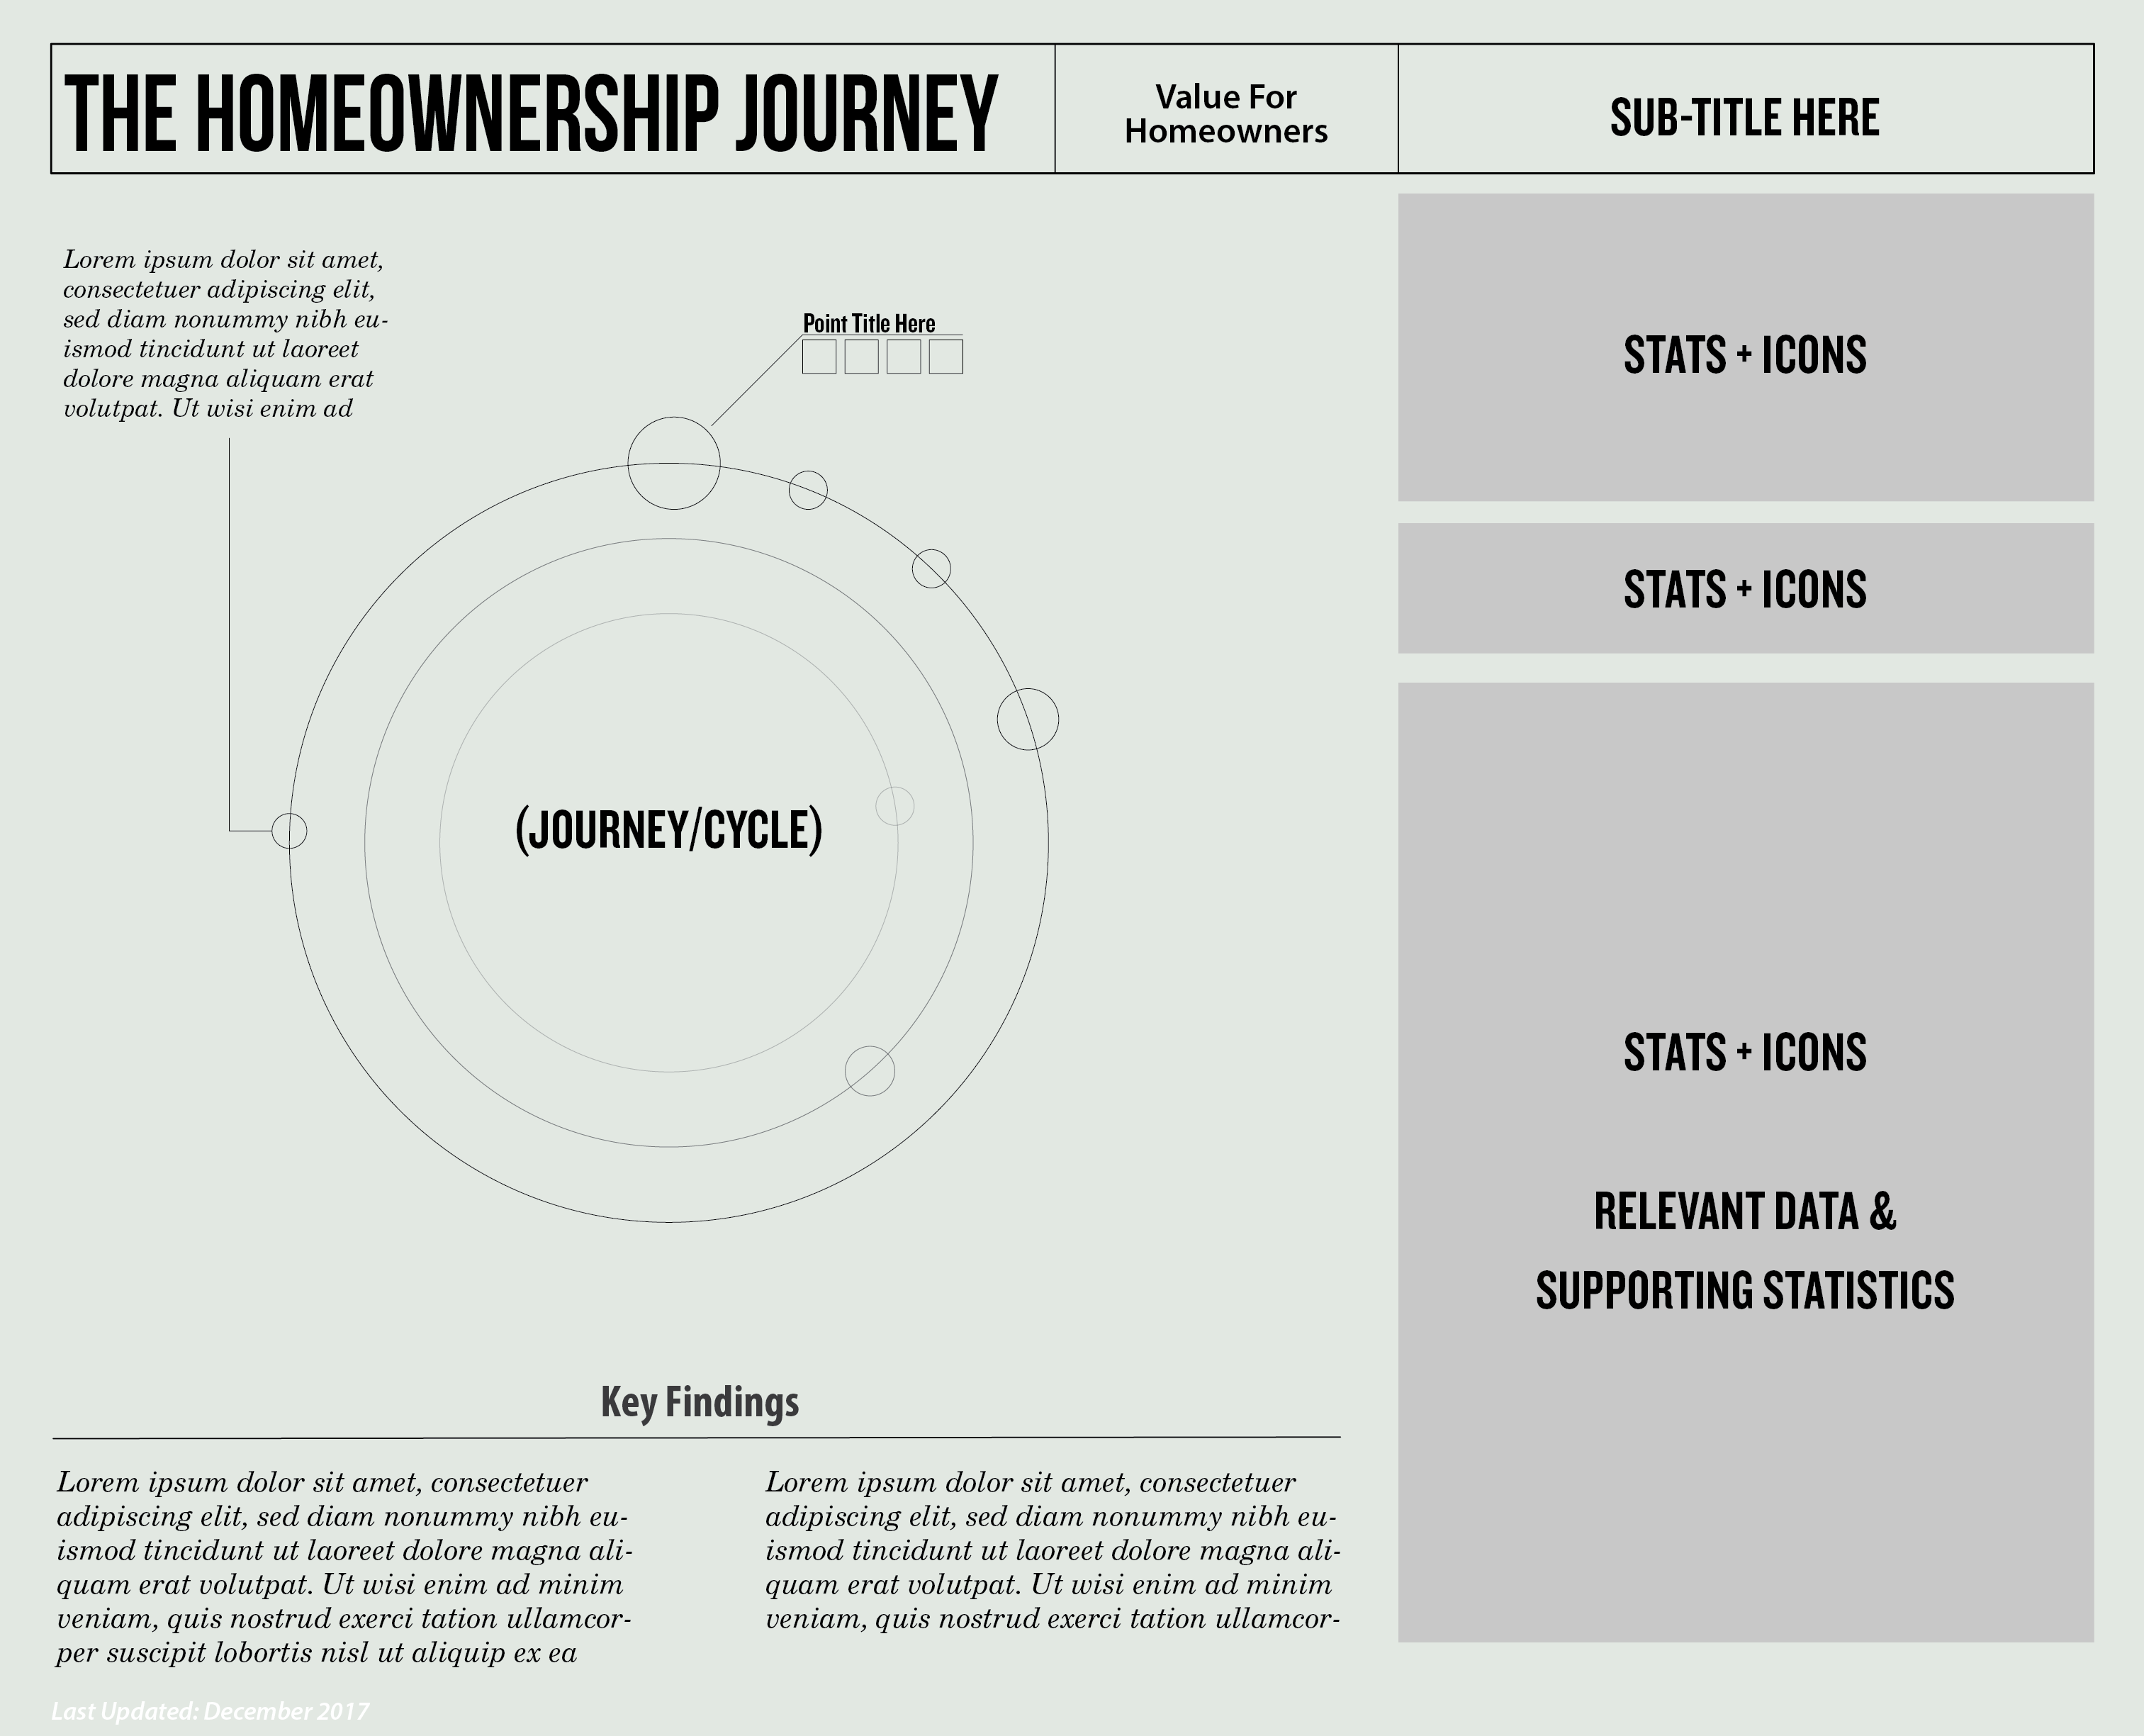
After a thorough discovery session, we determined that the best way to tell the complicated story of homeownership and the related statistics was a grid design with a semi-static journey graphic accompanied by changing data and statistics spread out over multiple "boards" that each covers a different aspect of homeownership and home services in America. Additional space was dedicated to discoveries and insights that would also change relative to each board.
Copyright 2021 | Zach Moe